Great Waves and L-Curves: Some Thoughts on the nfpSynergy Blogs

A few quick thoughts on the insightful recent pieces from Joe Saxton at nfpSynergy, which lay out some of the bigger threats and opportunities currently facing fundraising.

The challenges are spot on. Very hard to argue that squeezed incomes, growing public debt, lower Government funding, disintermediation and new technologies allowing more public fundraising are anything else but facts of life fundraisers must learn to live with. Perhaps most concerning is the fall in incomes which, combined with growing debt, will probably reduce confidence to give among a broad swathe of families, especially as these trends are so widely reported that, reporting which could curb confidence to spend. To my mind, these threats deserve far more attention and deliberative discussion.

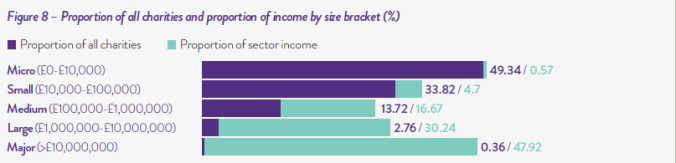
Great to see Rowenna Fielding use her comment to pick up on the fact that smaller databases need not be a synonym for shrinking income. She is absolutely right to say that “[r]educing database sizes so that they reflect high-quality engagement with supporters rather than large volumes of obsolete data is a good thing”. We now have many years of evidence to suggest that response rates for many charity marketing appeals are well below 1% in many cases. My own view is that sending appeal after appeal to largely unresponsive audiences has been one of the main reasons for the doubling of complaints about charity fundraising in four short years from 2012-2016. This model seems especially futile given that a tiny minority of donor provide a significant fraction of the income for many of our organisations. Many not-for-profit’s income base would look like an L-curve (with the L turned anticlockwise to lie on its long edge), with a third or more of all income coming from just one or two tenths of a per cent of the donor base (this trend also holds in the US, as the work of Peter Wylie has shown). Important to note too that since the 1970’s and 1980’s, when charities began to adopt database-driven marketing activities, the level of donations from private sources to UK not-for-profits has not risen at all (as far as data is available) and, as I wrote recently, has probably fallen as a proportion of economic activity far more quickly than many people realise. It also seems possible that the use of database-driven fundraising has increased inequality within the sector, with a small number of the very largest organisations reaping most of the benefits of marketing-led approaches. This links to Joe’s very pertinent point on mass affluence. Approaches to this group in recent years have often taken the form of ‘mid-value’ fundraising, where a combination of greater ask amounts, bespoke communications and dedicated relationship managers are employed with higher value donors to drive giving. Speeding up growth in this area, and exploring other methods to capitalise on the mass affluent market, will be an important part of solving the puzzle of how to grow overall giving in the coming years.

wileypic

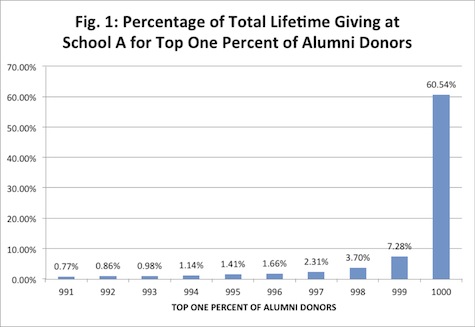
Just 0.1% of the supporter base often give 30%-60% of total donations, as Peter Wylie’s work has shown. See: https://cooldata.wordpress.com/?s=Lopsided

And while it is true that Legacies present a tremendous opportunity for fundraising, it is also the case that the ‘Bank of Mum and Dad’ is the 9th biggest mortgage lender in the country, and that unsecured credit is exploding (again) in the UK, leading to concern from the Bank of England and others that consumer credit growth is a risk to the economy. The estimated £6.8trn (trillion) value of UK homes does have extraordinary potential for to grow fundraising, this does I think have to be tempered by the fact that much of this value is either likely to be tie up in parents’ commitments to support their children to get on the property ladder. Having said this, it’s hard to see why the ‘giving while living’ model popularised for the wealthy by Chuck Feeney should not be rolled out more widely than it currently is, provided ways can be found to unlock value currently tied up in illiquid assets like real estate.

Joe and I share the same major concern, namely, who is going to guide charities towards the major structural changes needed to move from here to there. The ‘great waves’ of funding which have sustained UK not-for-profits over most of the last century originated (as far as I can see) in large measure from outside the not-for-profit sector. World War 2 drove many innovations in fundraising which are still with us today (including payroll giving, door-to-door collections, sponsored activities and selling goods to raise funds for charity). The establishment of the National Lottery was a Government initiative, driven personally by Sir John Major, with the huge increase in spending on and contracts to the Third Sector initiated by New Labour beginning in 1997. The fact that, as Joe says, the Institute of Fundraising, NCVO and other major bodies are showing rather little interest in nudging the sector towards a sustainable growth path should be of concern to all of us. Existing funding models are not in good health, yet the bodies who could help drive moves to new methods are not doing so. Will they ever?

Hokusai

Falling Flat?

The dominant narrative around UK not-for-profit income in recent years has either been of reasonable stability in the face of economic shocks, or of fairly gentle and understandable decline as older technologies become less effective. The release of the latest CAF Giving Report prompted me to look again at this narrative.

Some basic economic analysis of the CAF figures seems to show a different story than the ‘flat income’ narrative . The UK Giving Report usually reports voluntary donations in cash terms, as in the graph below. However, despite there being comparator figures for economic growth, there is rather little comparative analysis of the figures. This matters because economies are dynamic things – the value of a currency changes from minute to minute, and the overall amount of economic activity fluctuates over time, too.

CAF graph

It also matters as it means that the cash figures in the report do not show donations as a proportion of overall economic activity. Despite aggregate GDP growth of 15.7% from 2005-2015, (calculated simply by summing the figures in orange in the graph). Donations are shown as broadly flat, when as a proportion of the total economy they are declining by at least as much as the economy is growing, some 1.5% a year. In 2005, British annual GDP was £1.676trn, with donations at £10.3bn, or 0.0061% of GDP. In 2015, British GDP had grown to £1.889trn, with donations having fallen to £9.6bn, 0.0051% of GDP, an alarming 17.3% drop in donations as a share of the economy in just a decade. Another omitted trend is inflation; voluntary giving in 2005 was £10.3bn – £14.1bn in 2015 money; had charitable giving kept pace with inflation over this time it would in real terms be approximately £4bn higher than it currently is. When I asked them about inflation, CAF said “we have reported on this in previous years and may do so again but looking at it without adjustment is also useful because it shows that the actual amounts people donate are fairly constant, regardless of inflation levels”. Fair enough, though one would think that this type of economic analysis would be included in most years especially as, taken together, inflation and growth mean the same amount of money buys progessively less impact over time. This is especially noteworthy as the rate at which it is happening seems not to be widely realised, running (as it does) counter to the popular (and more reassuring) narrative of stability or gentle, heroic decline.

And consider all this in light of the sectors overall dynamics. I was struck to learn recently that one major national health charity’s income nearly doubled in the 10 years before 2016, at a compounded rate of 7% a year. In light of the above, the point is that this growth has come within a static sector, meaning that while the size of the cake remains the same, the slices for some are growing quickly, at the expense of others. Each year of no growth also reinforces the harmful idea that the current rate of voluntary donations is somehow a natural maximum and that therefore we are in a kind of secular stagnation where the best to be hoped for are year after year of flat numbers. My response to this is the graph below, which I’ve used before and will probably use again, showing steep recent growth in British sales of ethical goods and services. Growth for socially-oriented organisations is not only possible, it is happening:

ethicalgraph

That’s the past and present – what of the future? The declining share of the total economy devoted to voluntary donations suggests that, if the present trend continues, UK not-for-profit’s will by 2025 be able to fund around 34% less good work each year than if donations had kept pace with inflation and GDP growth over the 20 previous years. If unchecked, this would lead to a potential ‘crisis of relevance’ for a sector. I also worry about the financial health of mid-sized not-for-profits, (those with income in the £5m-£20m bracket) who, faced with stricter regulation and larger competitors with more financial firepower, could be forced to shut their doors or seek to merge to survive.

Ideas matter. The story we tell of not-for-profits’ place in our economy and society relies to a great extent on how we measure organisational impact, which in turn relies to a significant extent on income – relative and absolute. The above should sharpen focus on the declining effectiveness of some fundraising approaches, a decline which could well be far sharper than sometimes thought.

Rich List Redux

Another year, another Sunday Times Rich List and it is, today’s release tells us, “boom time for billionaires”.  Much is made of the rising level of philanthropic giving among the über-wealthy, but the bigger story seems to be the sheer overall rise in wealth, which is striking even for those of us who have kept a close eye on ‘The List’ in recent years.  Key stats are:

  • An overall year-on-year increase in estimated wealth of 14%
  • The top 500 individuals and families in 2017’s list are worth more than the value of the entire 1,000-strong 2016 list
  • A billionaire boom: 15 years ago there were just 21 billionaires listed; this year the figure is 134
  • The entry level of £110m is double that of the 2009 list
  • The 2017 total list value is more than six times that of the 1997 list, whose value was an estimated £99bn

banner

For charities, a 20% increase in the value of UHNWI philanthropy over the last year does not quite obscure the gulf between donations and the wealth of the haves and the have yachts.  While 260 philanthropists in the list are quoted as giving an estimated total of £3.196bn, up 20% from 2016, the potential for contributions from this group to completely transform the face of British philanthropy is beyond doubt – just 2% of the value of the Rich List would double private donations in this country, which currently stand at c£11bn-£13bn per year.  However, UHNWI donations continue to lag well behind even this number, and have not shown any sign of catching up with donations from the public more widely.  Particularly striking is the absence of any of the very wealthiest families in the Giving List index of the most generous HNWI’s.  Indeed, none of the 41 wealthiest ‘Listers’ – with estimated wealth in excess of £274bn – appear in the Giving List, and, with only a couple of exceptions, it is only once we reach the middle ranks of the list that significant donations kick in.  No doubt there are many anonymous donors at the top end of the list, and data used to compile wealth, power and philanthropy lists will of course always be partial at best.  However even taking this into account, it does seem that the gap between what is and what could be for British HNWI has never been greater.  Another trend is the rise in ‘giving while living’.  There are likely to be many reasons for this, however the rise of self-made money could well be feeding a more hands-on approach to philanthropy.  It is also likely that the pleasure of giving to good causes, as evidenced by Giving Pledge and other such initiatives, has had an effect.

And away from philanthropy, an ever-greater concentration of wealth gives more and more political clout to UHNWIs, whose political donations give them real – some would say really worrying – traction in the political process.  And at the confluence of politics, philanthropy and finance, I was especially struck by Crispin Odey’s donation of £873,328 to the ‘Leave’ campaign, as Odey bet (via his fund Odey Asset Management) that the UK economy would slow down in the event of Brexit.  The bet backfired however, as the UK economy powered on through, causing his marquee fund to lose almost half its value in a matter of months.

Nestled among new List compiler Robert Watt’s engaging prose are fascinating nuggets of trivia, some of which give make light of the unattainable wealth of list members. For instance Jack Ma (estimated net worth: £26.7bn) apparently thinks that the optimum earning level for happiness is £2,500-£5,000 per month – “the more money you have”, he is quoted as saying, “the more things you have to do”.  Another, perhaps even more germane, nugget is elsewhere.  In a fascinating interview with Management Today, Rich List founder Robert Beresford says that “around 90% of the [lists] wealth is not liquid, it is tied up in the businesses that the current rich or previous generations have built”.  This shows two things – first, that the fraction of British HNWI wealth needed to significantly raise overall private philanthropy is far higher than first impressions of headline figures suggest.  Second, that, as a result of this, fundraisers will have to work very hard to build strong enough relationships to achieve such increased gift levels.  A tough ask – but by no means impossible,

It seems that, as Beth Breeze’s recent Good Asking report suggested, fundraising research is needed – now, more than ever.

Run DMCMC

Run DMCMC

Turning the geek factor up to 11 for a moment, there are some interesting possibilities for mathematical techniques used in technologies like predictive text to be used to assess fundraising interventions.  Ever since an influential 1948 paper by Claude Shannon – “the Father of the Information Age” – so-called ‘Markov Chain’ models (a variant of which is  ‘Markov Chain Monte Carlo’, or MCMC) have been “widely used in speech recognition, handwriting recognition, information retrieval, data compression, and spam filtering”, as well as ‘Natural Language Processing’/word prediction, by assigning probabilities to ‘state transitions’, ie the probability of one letter or word following another.  Using such chains to predict which fundraising interventions are most likely to lead to a gift would be a huge boon for the industry, leading (in theory at least) to far more efficient donor journeys and more granular understandings of business process value.  So, who wants to Run DMCMC?

Ratio’s(ination)

Imagine an ant crawling along a beach, left and right, forward and back, up and down, as it navigates home. It’s chosen path looks something like this:

Ant walk pic

The route is complex, but the complexity is a product of the environment, not the ant, whose decision-making power is minimal.  The example is abstract but relevant for people, too: “human beings, viewed as behaving systems, are quite simple. The apparent complexity of our behavior over time is largely a reflection of the complexity of the environment in which we find ourselves.”

The question of how to navigate complex environments using limited decisionmaking capacity and incomplete information is at least as relevant for organisations as it is for animals.  As a fascinating recent post [login required] to the Prospect-DMM email forum suggests, the answer may lie partly in the use of ratios, which offer an elegant, contextualised ways to cut through bewildering amounts of information.  Simple, powerful metrics to use in fundraising could include:

  • Last five years giving/lifetime total
  • Responses/contacts
  • Number of appeal/number of gifts
  • Cost of appeals/lifetime donations

One obstacle is not being able to integrate or even extract information from our database systems to begin with.  Recent news that insurance giant Aviva has made great strides in integrating database systems to the great advantage of their business raised a thought which is highly relevant for many charities: are we prisoners or masters of our IT/database systems?  And, when techniques like database screening may be restricted or even off-limits in future, can we afford not to try to mine other data for insights?

Weapons of Math Destruction

If, as the ICO believes, the British public would experience “substantial distress” in learning their data had been processed in a wealth screening, the public will surely be distraught should they ever read Cathy O’Neils 2016 book Weapons of Math Destruction: How Big Data Increases Inequality and Threatens Democracy.  The many ways in which mathematical models and algorithms – the so-called ‘WMDs’ – are used to make crucial decisions relating to the public realm and, increasingly, private lives are as worrying and widespread as they are opaque and unaccountable.  Across vital issues like criminal justice (where court decisions increasingly use automated quantitative modelling and scoring), access to credit, finance and education (where credit scoring and rating of teachers increasingly rely on WMDs), jobs and employment (where a missed payment could mean being overlooked for a job interview) and even the feelings and emotions we experience (thanks again, Facebook), WMD’s are in wide and growing use.  This largely unseen trend is worrying as WMD’s inevitably contain errors and anomalies which, if not caught, can have significant effects for those affected by their scores or results.  Even worse, WMDs can have pernicious effects when they run perfectly – many contain implicit value judgements which end up disadvantaging poorer groups, or, in the case of aggressive advertising, are designed to target these very people.  Yet all too often WMDs’ methods and results go unchallenged.

O’Neils Mathbabe blog is an engaging mix of political commentary, engaging geekery and knitted hats – well worth a read.  And both are valuable and timely in helping us to understand – and hopefully better manage – our algorithmic overlords.

Where is the Money (Going to Be)?

In No Country for Old Men, menacing assassin Anton Chigurh (Javier Bardem) shuns Woody Harrelson’s frightened offer of help to find a satchel loaded with millions of dollars.  “I can find it from the riverbank”, a terrified Harrelson pleads at gunpoint, “I know where it is”.  “I know something better”, counters the icy Chigurh, “I know where it’s going to be”.

Chigurh Hotel Scene pic

As fundraising researchers, we spend a lot of time focusing on where the money is.  But do we spend enough thinking about where it is going to be?  The scene is a reminder that to prospect by relying on companies or sectors enjoying current success (as a way to assess employees’ affluence) is to miss a trick.  Do we prospect often enough by trying to predict which sectors will become successful in the future?  It may sound like a fool’s errand, but understanding which sectors and products are on a strong growth path and likely to experience an uptick in growth – wearable tech, virtual reality, voice recognition technologies and peer-to-peer finance come to mind – would be a boon for prospect research.  Intelligence on mergers & acquisitions, IPOs and other comparable ‘liquidity events’ is equally valuable (lookin’ at you, Aramco).  Such horizon-scanning need not be resource-intensive and is par for the course for many investors and businesses – for very good reason.

Calling Bullshit

How to call bullshit in the age of Big Data?  There is now a whole course designed to do just that, and it is the best thing ever (no b*llshit).

callingbullshit

Some Thoughts After a Summer of Reading & Watching Films

Numbers Not Words: Towards the end of the film ‘Zero Dark Thirty’, Defense Secretary Leon Panetta (played by James Gandolfini) quizzes his team on the likelihood of Osama Bin Laden being in hiding in the Pakistani town of Abbotabad.  “Is he there or is he not f–––––– there?” he asks. Analysts offer probabilities between 60% and 80%, until the protagonist, Maya (Jessica Chastain), chimes in: “A hundred percent he’s there,” she says. “OK, fine, 95%, because I know certainty freaks you guys out. But it’s a hundred!”

chastainZDT

The scene is notable for the numbers, not the words. Completely unremarked, each person offers a numerical percentage estimate.  This is no accident.  After the 2nd Iraq war, the US Intelligence Community undertook an enormous cross-departmental excercise to improve the quality of its forecasting, which was recognised after the (hugely expensive) war to have been poor at best.  One of the recommendations was to do away with vague, textual predictions (“quite likely”, “probably will happen”, “may not take place”) and forecast using only percentages.  Another outcome of the excercise was the establishment by the US Intelligence Advanced Research Projects Agency (IARPA) of a forecasting tournament pitting teams of experts against one another in a test of forecasting ability.  The shock winner was the Good Judgement Project (GJP), a team of enthusiastic amateur forecasters marshalled by Professor Phillip Tetlock and his team.  Professor Tetlock’s book Expert Political Judgement: How Good Is It?  How Can We Know? caused a sensation some years earlier by showing that political pundit ‘experts’ have less forecasting ability than would a monkey throwing darts at a board, ie. that their predictions were worse than random guesses would be.  Professor Tetlock has said that the landmark 20-year study underlying Expert Political Judgement was inspired by a comment from Noble Prize winning economist Daniel Kahneman that most experts were no better forecasters than the average New York Times reader.  The GJP team easily beat their higher-paid, better-resourced Government opponents, who have now enlisted Tetlock and his associates to teach them how to forecast future events.

The upshot: anyone with any interest in forecasting should read the Tetlock/GJP work, starting with his most recent, Superforecasting.  The next major gift may just be round the corner, but there are lots of corners and it helps to know which one to take to find it.

Occupy Philanthropy: Malcolm Gladwell’s priceless tweet got me thinking about inequality and not-for-profits.  There is surely a thesis to be written on the fact that the British charities sector is one where 0.36% of organisations raise half all funds, while half of all charities raise 0.57% (chart below is from the NCVOs Financial Sustainability Review).  How can we speak with a united voice with such stark divisions?  And when 62 individuals hold as much wealth as half the world’s entire population, how can causes not popular with the (very) wealthy thrive?

NCVO chart charity size_income

The Curious Case of Building 20:  During World War Two, American Universities were required to join the war effort.  The Massachusetts Institute of Technology (MIT) was no different, only they had a problem: after all the major departments had been assigned office space in their re-worked campus, an assortment of smaller, less established departments were left.  These included Linguistics, Electrical Engineering various branches of Military Studies and even a piano repair facility.  Eventually, a ramshackle temporary wooden building was constructed to house the departments, designed to last “until the end of the war + six months”.

But a funny thing happened.  ‘Building 20′, as it came to be known, left a remarkable legacy.  Because it was never considered prime real estate on campus, occupants were free to modify the cheap building at will, making the space more comfortable and useful.  The eclectic departments and oddly distributed seating plan meant academics from unrelated disciplines sat close by and were free to share ideas and listen in to their colleagues’ meetings, and the randomised floorplan and single-storey structure made chance conversations with academics from random departments almost impossible to avoid.  Even a walk to the bathroom gave opportunities to bump into colleagues from completely unrelated disciplines, and for new and unexpected connections to be made between subjects, and people.  “Scientists working there pioneered a stunning list of breakthroughs, from advances in high-speed photography to the development of the physics behind microwaves. Building 20 served as an incubator for the Bose Corporation. It gave rise to the first video game and to Chomskyan linguistics”.  By the time it was finally demolished in 1998, the building was legendary for the extraordinary number of inventions and innovations whose origins lay in the shabby building.

Chance encounters between people with radically different skill sets can be hugely valuable, and are almost free for organisations to engineer.  Why doesn’t everyone do it?

Conviviality: How can not-for-profits help their employees be convivial, learn about one another, and turn the walls built by the working world into bridges?  Theodore Zeldin’s recent book is a reminder that work can and must be about more than a trade-off between ‘real’ life and something called “work” we need to “balance” against.  What if charities not only used donations and grants to deliver services, but  connected their supporters with one another, and their employees, building a mass-movement of people with shared interests and outlooks?  The imperative for this was clear as I looked at a poster in Barcelona of a Catalan charity asking for 3 to help an older person escape grinding loneliness.  While whole global businesses were built in the 20th century to fill houses with furniture, driveways with cars and planes with passengers, the third ‘revolution’ (following those in agriculture and industry) may be to fill far more lives with meaningful relationships, and to facilitate the creation of such links (Zeldin’s ‘conversation dinners‘ are one suggestion ).  This in turn could be a chance for charities (and organisations more widely) to evolve to provide not only more meaningful work, but also a solution to some of the biggest societal challenges of the 21st century, including isolation and poor mental health. Karl Wilding’s comment to the Lords Select Committee on Charities that some charities are reimagining themselves as social movements may prove to be very prescient, and not only because charities are seeking greater social proof of their causes.  The post-war model of donations for services is creaking loudly; movements funded and lead by coalition-networks of the interested, willing and able may be the future.  Am I wrong to think that’s an exciting prospect?

A Future To Believe In?: Bernie Sanders has had a busy year.  Two of his notable achievements (other than breaking the internet with a sparrow) were raising almost $230m from 8m donors with an average donation amount of $27, and, in doing so, soundly disproving the notion that low-value fundraising is old news.  Though his tilt at the Democratic Presidential nomination was ultimately unsuccessful, (not entirely due to consummate HRC campaigning), Senator Sanders moved the terms of the political debate by financing his campaign through small contributions from individuals.  This allowed him both to run on previously neglected issues of inequality, healthcare and police reform, political campaign finance and media biases in a way that would have been difficult or impossible had he appealed for major gifts from wealthier constituencies.  He also got political traction against his opponent in painting her as a creature of the Wall Street elite.


berniebird

Charities take note, especially of Sanders’ teams use of online fundraising, through which they raised the majority of the funds used in his Presidential nomination campaign.  The Sanders case demonstrates that a principled, urgent call to action delivered intelligently to a receptive audience who are asked to support a discrete goal works as well now as it ever did.  It also lends weight to the argument that small donations can have a big impact – a year ago relatively few people outside Vermont had heard of Bernie Sanders; he is now one of the best-known politicians in the US.  Fundraisers can learn much from his innovative, disciplined campaign.

Lastly: States collect revenue through taxes, not gifts; indeed, states who rely on gifts to function are said to have been “captured” by “special interests”, called clientelistic, or even labelled as “failed”.  As James C. Scott’s seminal Seeing Like a State makes clear, states (ie the frequently coercive bureaucratic infrastructures of authority on which nations are built) do this as it is the worst way to collect revenue, except all the others.  Is there enough discussion of the downsides of donations?

Craig Dearden-Phillips MBE: “Charities must adapt or die”

Craig D-P

I was delighted to interview Craig recently – his Third Sector articles on charities’ needing to adapt to new funding realities and what went wrong at Kids Company were, for me, among the best of 2015.  He tweets @DeardenPhillips.

His message for charities is clear – that the golden days of (mainly Government) funding are over and we must think hard about the best way our organisations can make the most impact.  This fits with my theory that the three big income streams which have propelled British charities since WWII (50’s/60’s the rise of the generous baby boomers, 70’s/80’s the CRM revolution and ‘fundraising as marketing’, 90’s/00’s New Labour/central Government grants/spending) are, for very different reasons and in very different ways, all ending.  The challenge this presents to British charities should not be underestimated.  In the interview, Craig explains the reasons behind his thinking and gives some predictions about how these will play out among charities over the coming year.  Enjoy.

The interview can be downloaded here, along with all the others from the site.  Apologies for the slightly crackly sound quality in parts of the recording.